The Great Election Model Face-off
I’ve built this website to compare how well 538 and The Economist predict the election results.
I’m NOT all that interested in which famous statistician ‘wins the day’, however I AM really interested in how the assumptions we make in models play out in real-life (and high-stakes) scenarios. There has been a lot of discussion on the relative merits of each model, focused mostly on shape of the distribution (whether a model included ‘fat tails’ that allow for a possibility of large upsets), and how to best model the correlation across states (E.g., when and where its reasonable to assume low or negative correlations across states).
These assumptions make a big difference, because they shape the narrative of what we expect come election night.
On Tuesday, I’ll compare the performance of these two models as the results come in, seeing how well the models predict the democratic vote share in each state. While election night will be winner-take-all, predicting the actual vote shares allows for a finer-grained comparison of these models (e.g., they both predict the same outcomes: a Biden presidency).
Real-Time Model Comparison
This is the simplest way we can compare the performance: just look to see which model’s point estimate is closest to the current results. While this is an intuitive way to view the data, it doesn’t take into account the uncertainty in each model, which is their biggest source of difference.
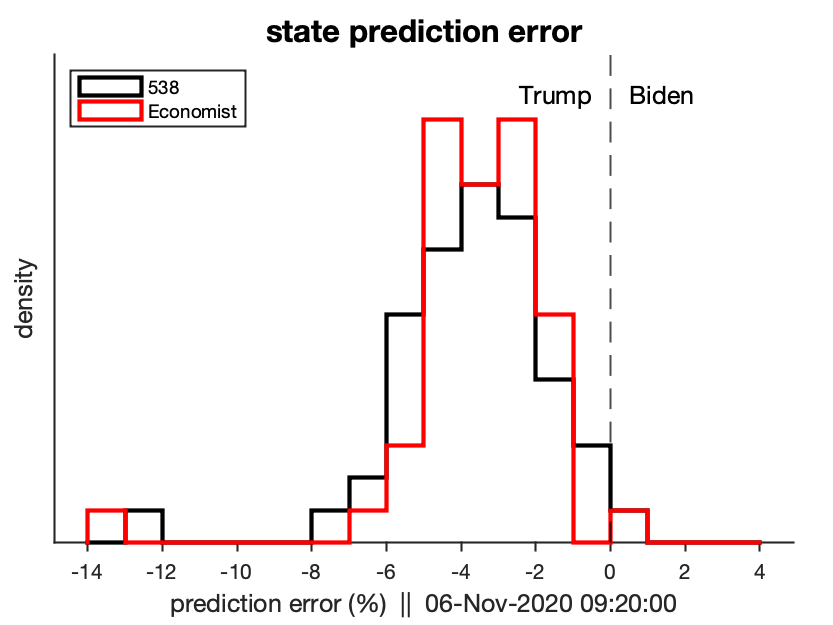
As of the morning of Nov 4, it appears that both models have systematically underestimated Trump’s performance, but this is likely in part due to sampling error (i.e., many commentators are saying that later mail-in votes could skew more strongly for Biden).
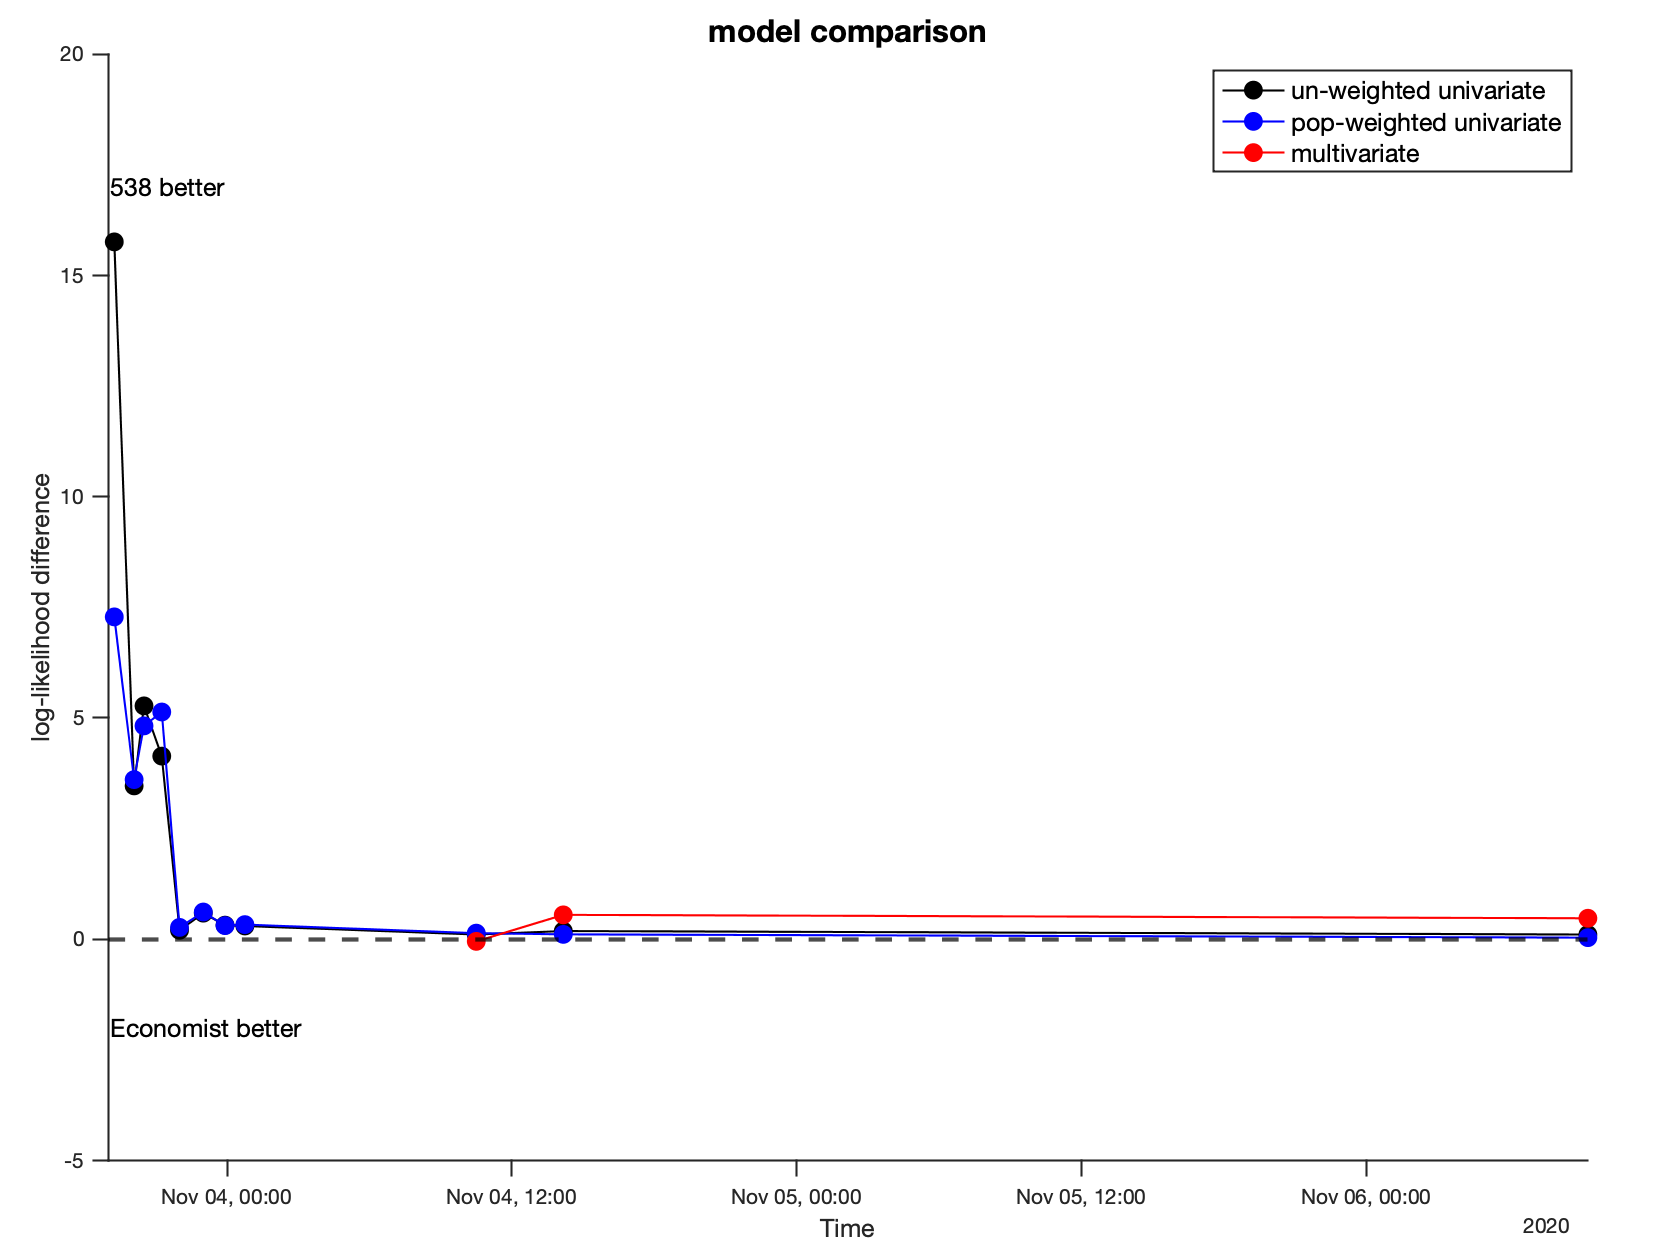
I’m comparing the performance of 538 and The Economist in three ways: (1) averaging the model likelihoods across reported states and (2) weighting the likelihoods based on the relative populations in each state (to give more credit to the model that does ‘better where it counts’), and (3) once all states have reported, under a multivariate likelihood. The liklihoods are generated using kernel density estimation.
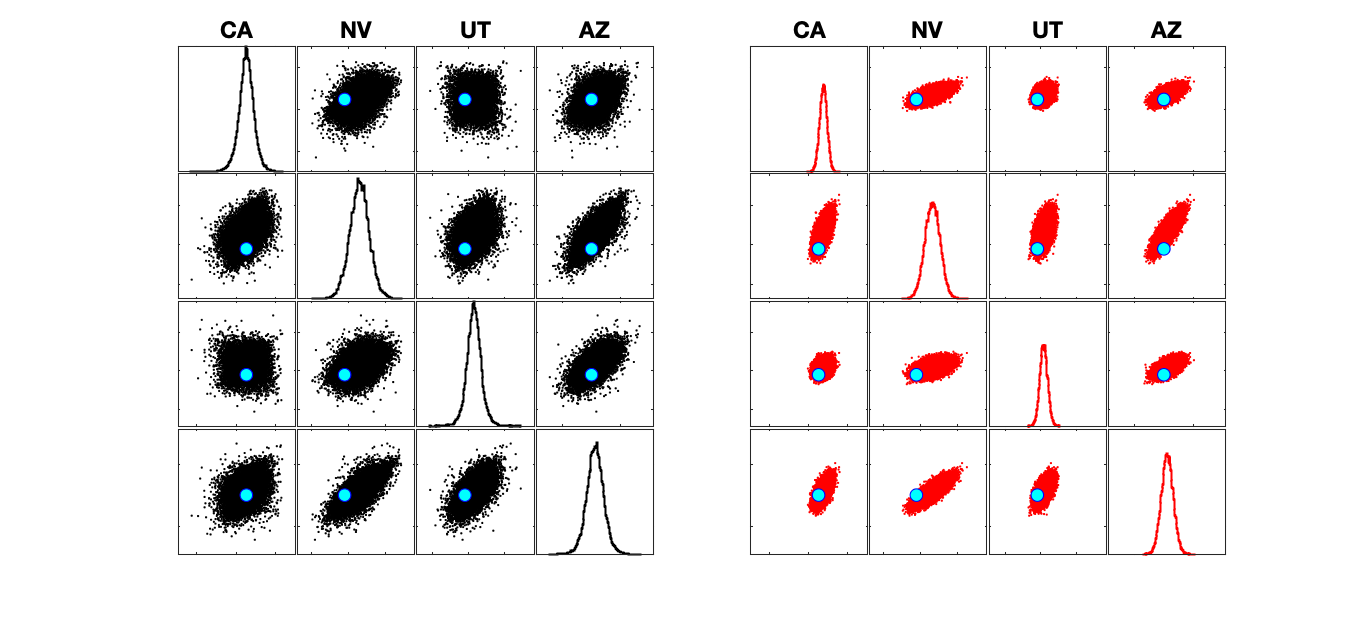
Below we can see how the incoming results (blue line / cyan dots) compare to each models’ predictions.
In all of the graphs, 538 will be plotted in BLACK, and The Economist will be plotted in RED.
These figures will be updated periodically as new results comes in.
Model Validation
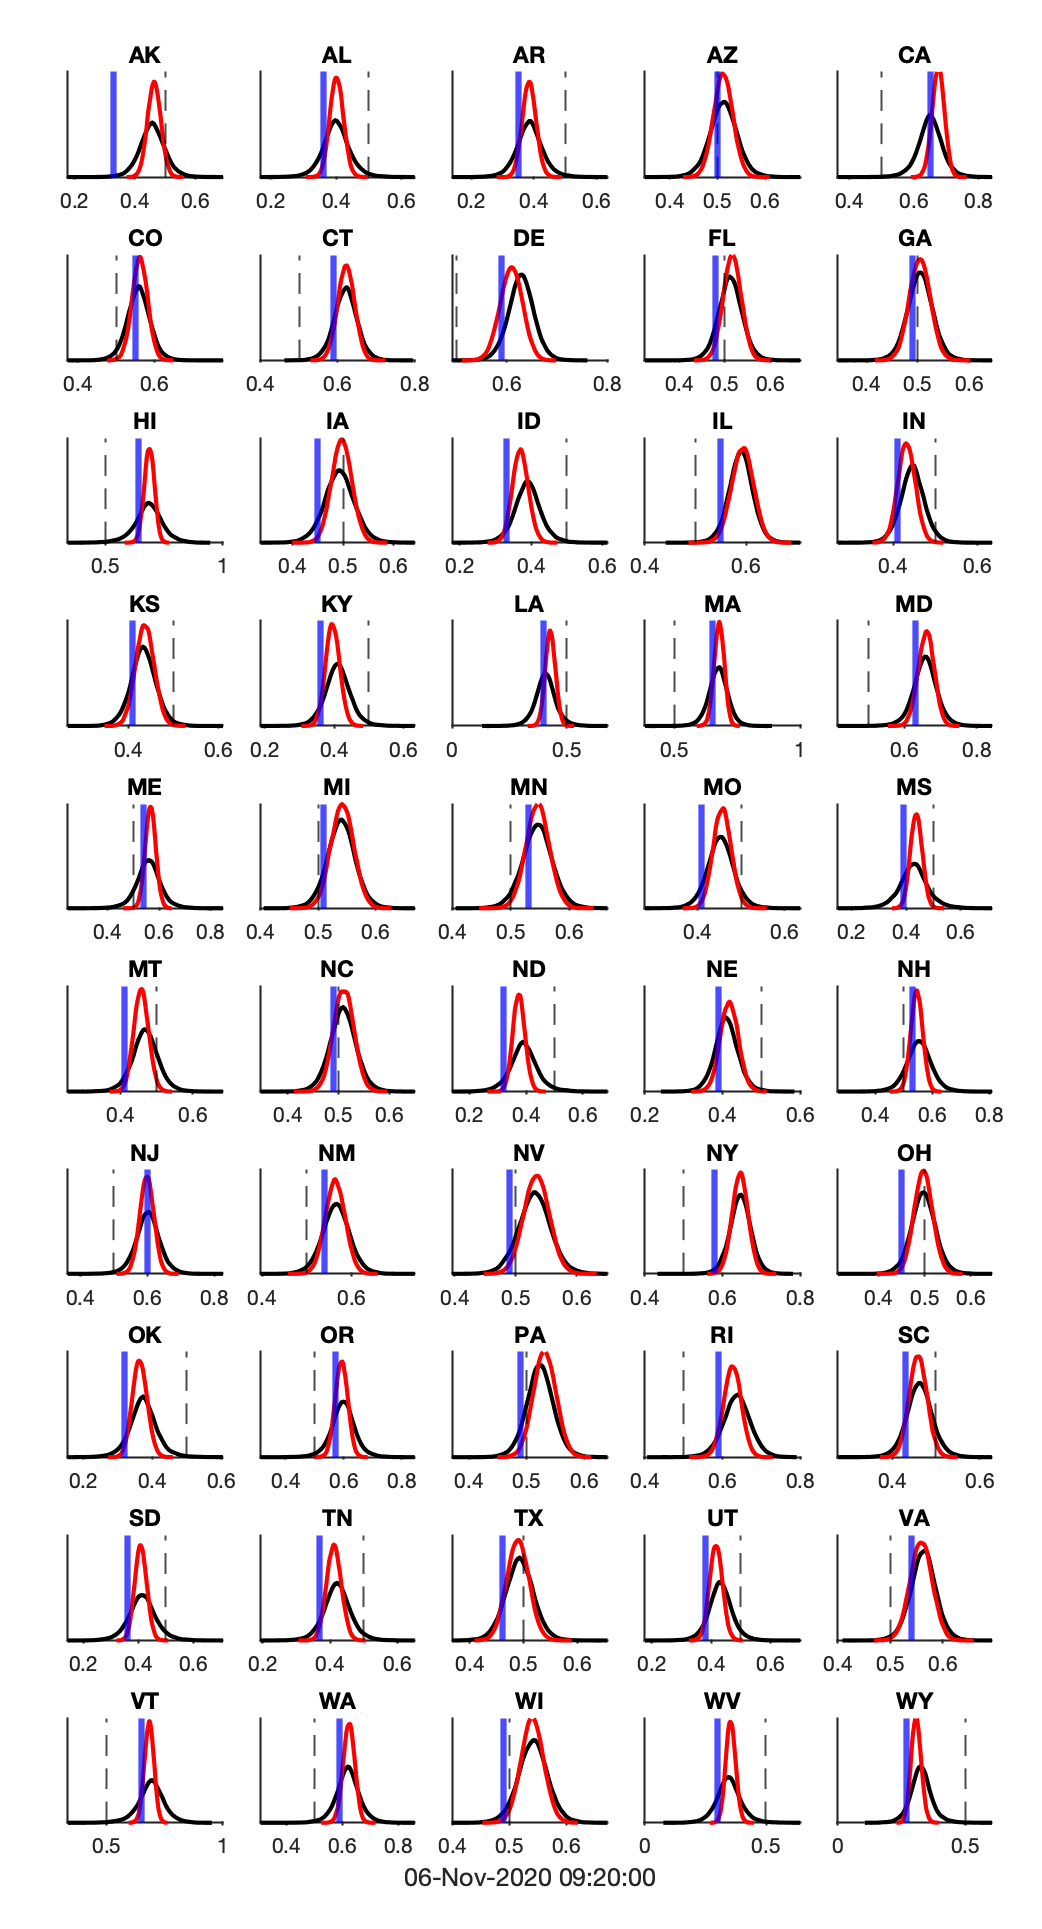
First, let’s look at the outcomes each model predicts at the state level, ignoring the correlation across states. We’ll be basing all of these analyses off 40,000 simulations from each model, predicting the state-level vote share.
In all of the graphs, 538 will be plotted in BLACK, and The Economist will be plotted in RED.
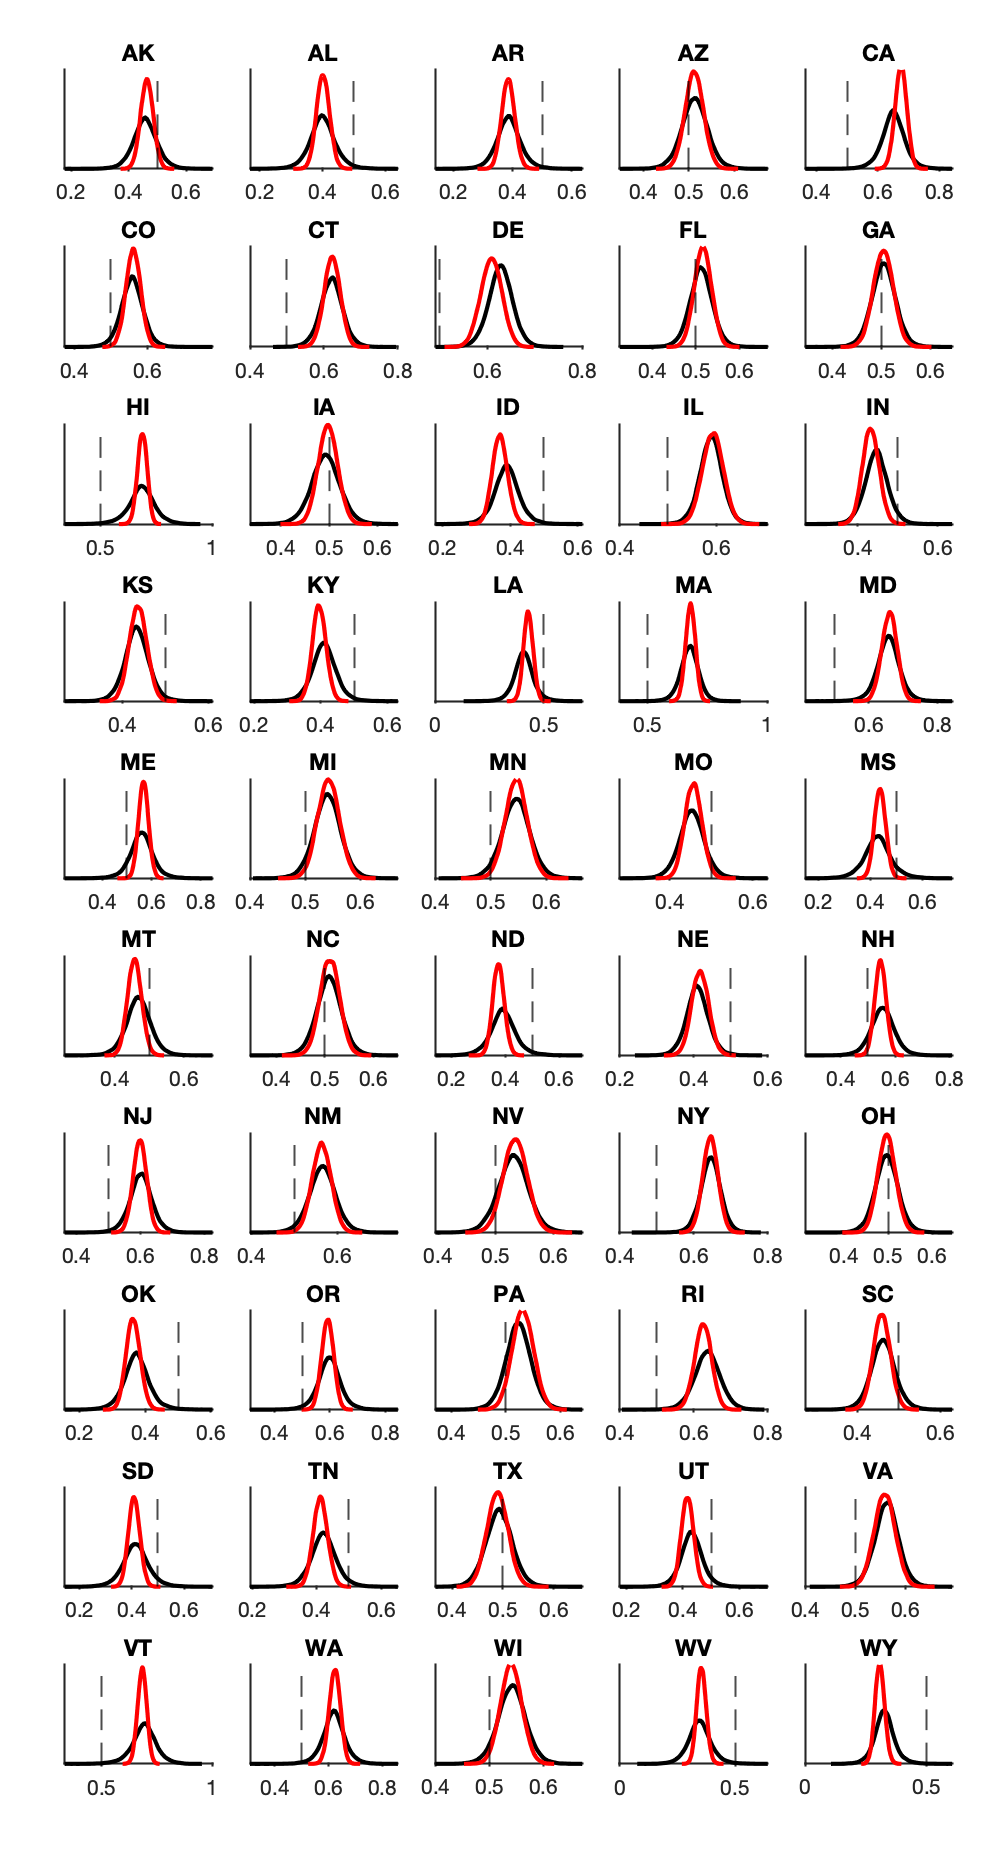
What’s immediately clear from this figure is that The Economist is a lot more confident in their predictions – they have a very peaked distribution around their expected vote share. In contrast, 538 has a longer-tailed distribution, making less precise predictions, but accommodating unexpected results. Despite those differences, the models are predicting very similar results, especially for who will win the night.
Stronger differences between the models come from when we look at their multivariate predictions, how they expect the results in one state to depend on the others.
First let’s look at how the models expect the vote share in different states to correlate with each other.
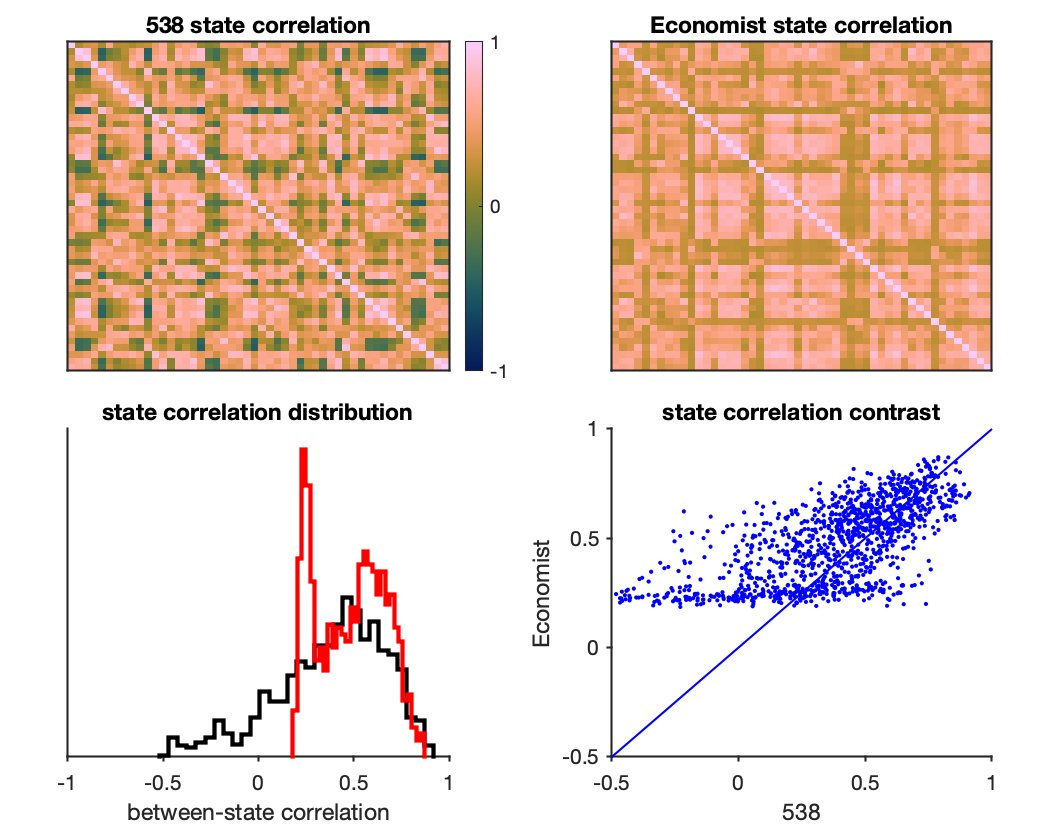
Two things jump out at me here. First, the state correlations in 538 cover a much broader range, including negative correlations, whereas The Economist only have positive correlations between states.
Second, when we plot the distribution of correlations (i.e., the lower triangle of the correlation matrices) the The Economist appears to have a bimodal distribution. I originally thought that this might reflect party polarization. But when we contrast the state correlations across models (bottom right), it becomes really obvious that The Economist has set a lower-bound on their correlations, likely due to the link function they used to estimate the between-state covariance (i.e., it looks like they forced the correlations to be above a certain value).
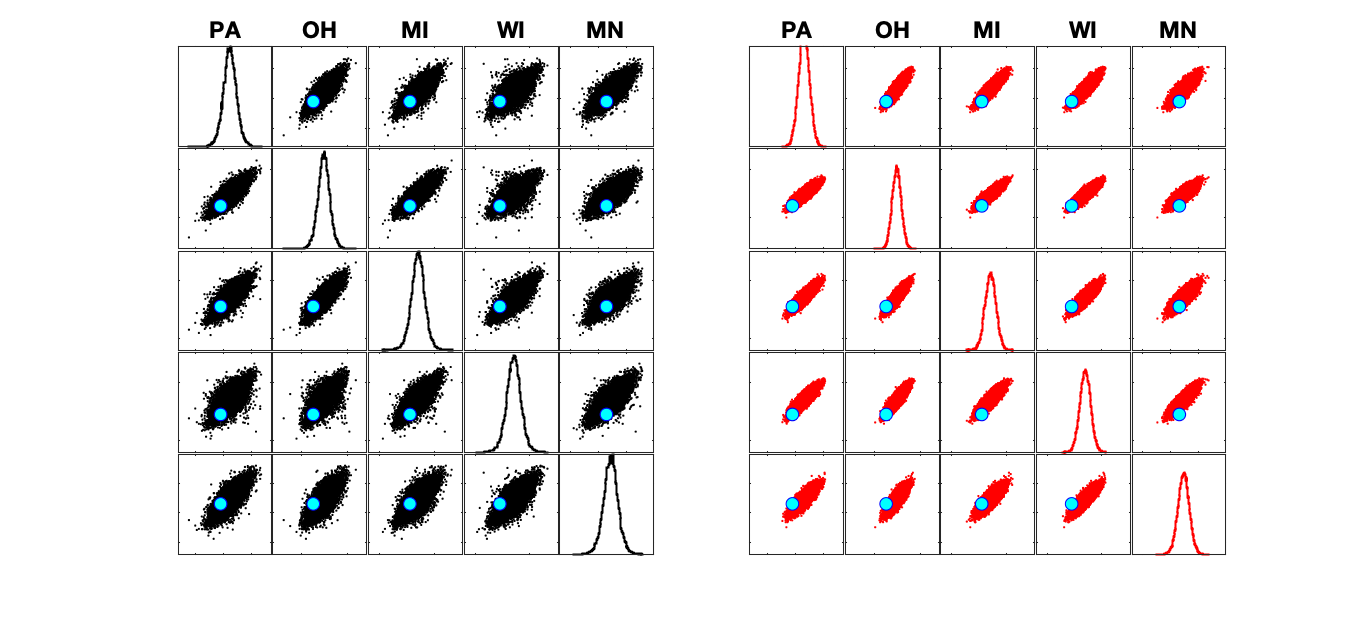
We can zoom into the correlations between a few states (New England) to see how these models differ at a finer-grained level.
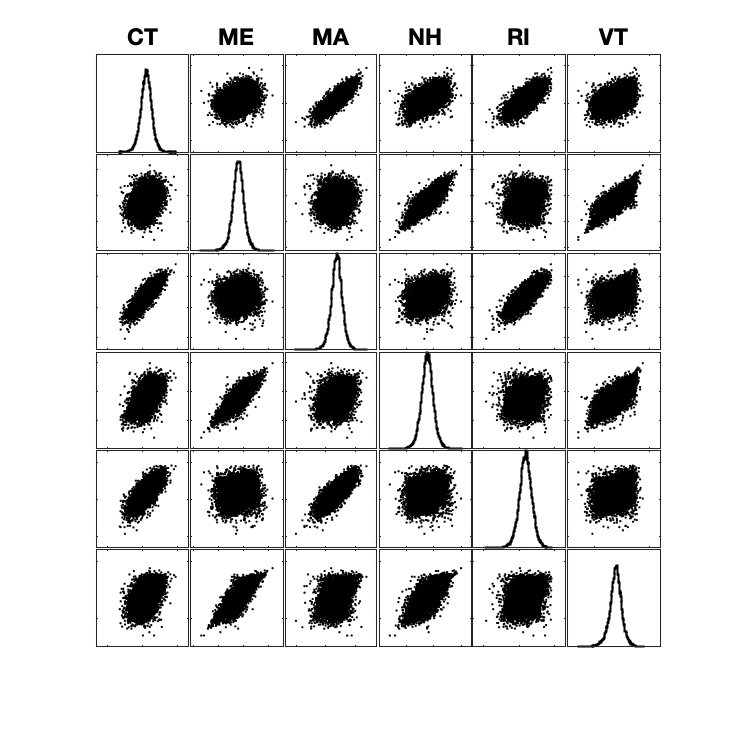
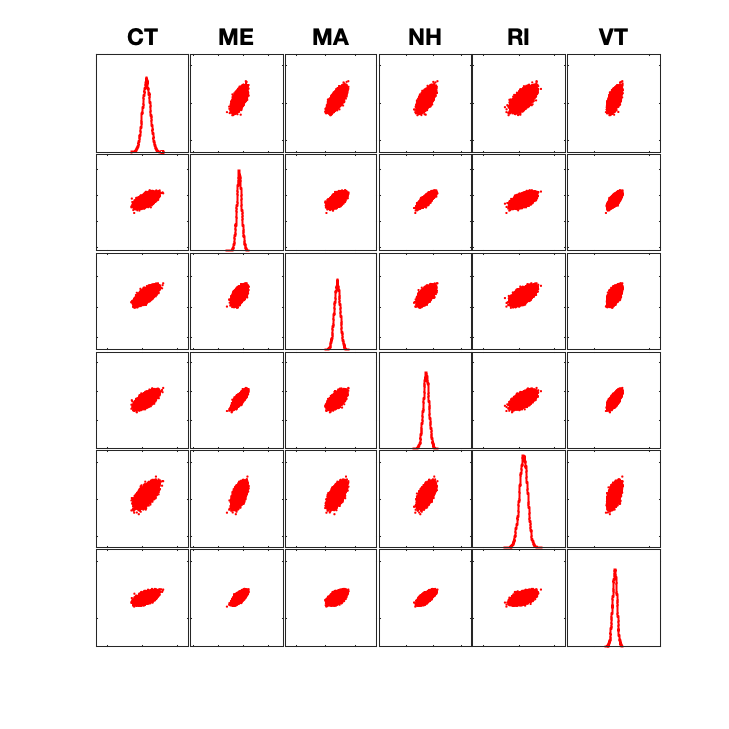
Clearly, the 538 model is a lot noisier, allowing for surprising upsets. However, it is also noticeable how much weaker some of the correlations are between these states – notice how different Rhode Island is from much of the rest of New England in 538’s model relative to The Economist. This is likely due to state-independent noise being added to 538’s simulations, incorporating a different assumption about the extent to which election outcomes are driven by local factors than The Economist.
Finally, I was curious about what is driving the across-state structure in these models. To examine this more carefully, I got a measure of the similarity between states (the euclidean distance between states’ vote shares across simulations; z-scored to remove between-state differences in vote share), and then embedded the states into a low-dimensional space (using ISOMAP). I embedded the state distances for each model separately, and then aligned them (procrustes transformation).
This is really complex! The obvious thing to me is how much more dispersed the 538 states are (this may be due to their state-independent noise). You can also see at the bottom that The Economist groups several of the southwestern states together, and at the top they group some of the New England state together.
One way we can get more insight is to look at how the embedding represents differences between states. The first thing I’ve tried is to label the states based on whether they are expected to vote Democrat or Republican:
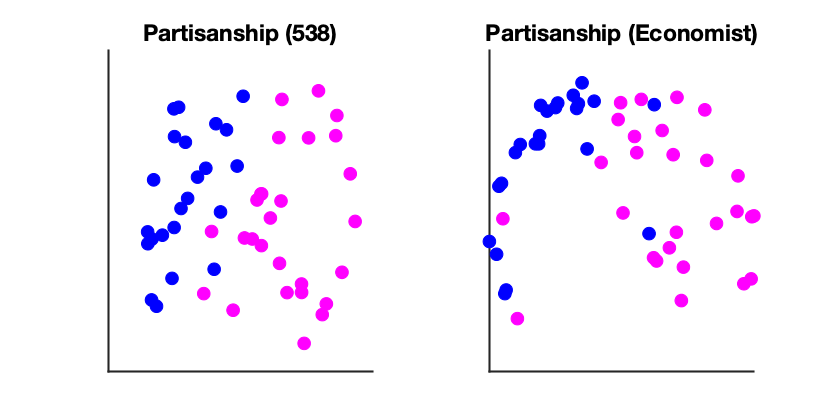
It would seem like partisanship plays a role in the between-state structure, though we should keep in mind that states that vote similarly are also geographically nearby as well. It does seem like partisanship plays a larger role in 538, whereas the Economist appears to pick up on some other structure (perhaps it is weighting geography more strongly).
Model Recovery
Despite the differences between these models (especially at the multivariate level), it’s not totally clear whether they make different enough predictions that we’ll be able to compare them on election day. To test our ability to discriminate between these models, I compared the model likelihood of each model given data simulated from each model (i.e., model recovery).
The model likelihoods for were calculated using multivariate kernel density estimation on the simulated vote shares from each model. I have a little discomfort about how to choose the bandwidth and kernel given the different assumption of these models (i.e., 538’s fat tail). For the bandwidth, I landed on Silverman’s Rule of Thumb with min(STD, IQR), and for the kernel I used the Epanechnikov kernel, but confirmed that things looked similar with a t-distributed kernel.
Using these kernel likelihood functions, I compare the models’ likelihoods under both held-out simulations from the same model (e.g., 538 model ~ 538 sims), or under simulations from the alternative model (e.g., 538 model ~ Economist sims). Since we have a lot of simulations, I just did one cross-validation fold (36k in-sample, 4k out-of-sample), but this is something I could spruce up with a k-fold cross-validation.
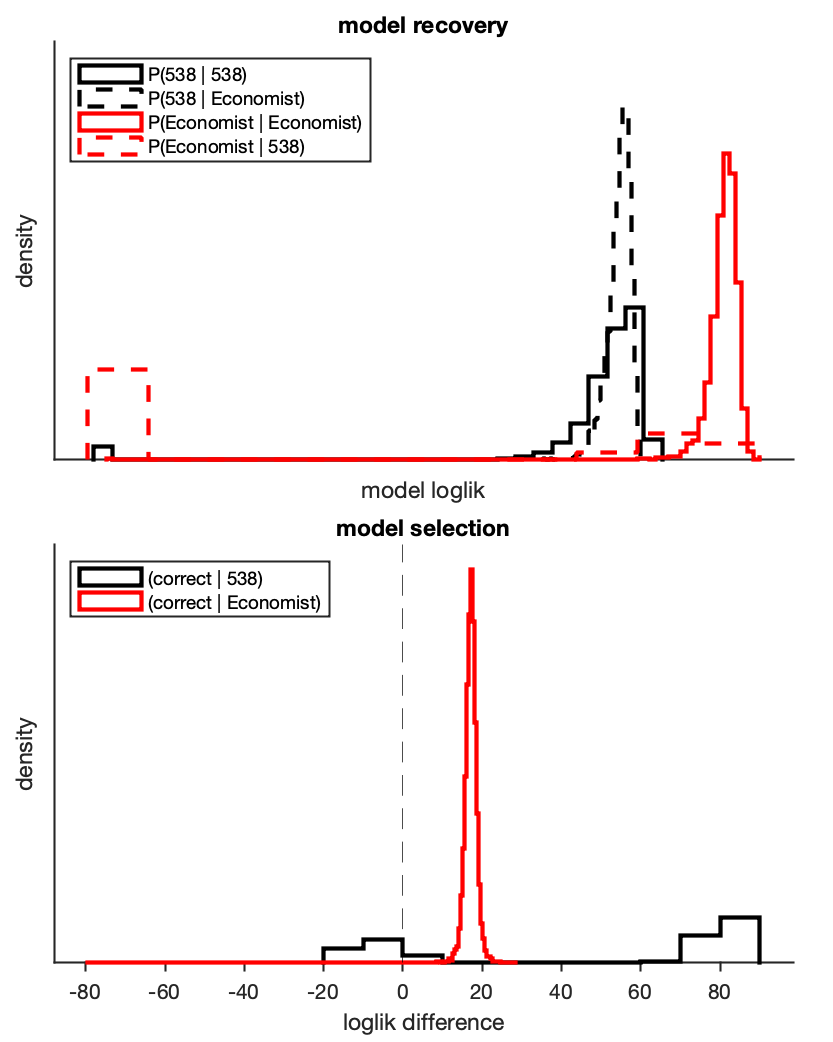
The top panel is a little complicated. Solid lines indicate that the model matched the data-generating process, and we can see that both models do a pretty good job, with the Economist have a higher likelihood under its own data (not surprising, given how peaked its predictions are).
In the dashed lines, we can see the models’ likelihood under the wrong data-generating process, and this is where things get a little more interesting. Whereas the 538 model does pretty similarly whatever data it uses, we can see that the Economist model does quite poorly when data are generated from the fat-tailed 538 simulations (see: red dashed line). This is the downside of peaked predictions – they’ll do great if they match the data-generating process, but will really suffer if things are noisier than they expect.
For our purposes, the bottom panel gives a better picture of whether we’ll be able to distinguish between these models. Here, I bootstrap sampled the model likelihoods, comparing the correct vs incorrect models (i.e., P(538 ~ 538) - P(Economist ~ 538)).
If the data are generated from the Economist model, we’ll still be able to pick the right model 99% of the time. However, if the data are generated from the 538 model, then we’ll only be able to pick the right model ~62% of the time, and will often mistakenly prefer the Economist. Why is this?
My guess was that the model will be discriminable when there’s some weirdness, when the data have some likelihood at the tails 538 model but very low likelihood under the peaked Economist model. To test this, I compared how well we can discriminate between the model (likelihood difference) as a function of how well the models fit overall (likelihood sum):
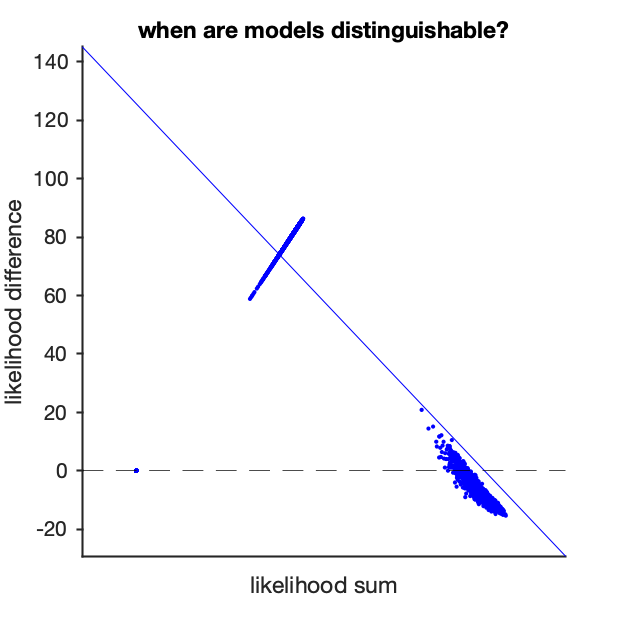
This appears to be the right intuition – the 538 model fits better for unlikely outcomes, but the Economist fits as well or better when the data come from the center of the 538 distribution. Hopefully we get lucky, and the election well-behaved tomorrow even when it could have come from the tails, but that will mean that it will be difficult to tell these models apart!
To sum up, we if the election goes more or less according to the models, the Economist model will fit better, but if ‘going well’ means that we’ve dodged a bullet, then we ought to give the 538 model more credit. As many commentators have said before, this kind of counterfactual is exactly when predicting a single isolated outcome like an election is so difficult.